The 94% Problem: Understanding Variation and Why Managers Keep Blaming Workers
You can’t inspect quality in. You must build it in by understanding and reducing variation in the process.

In the previous posts, we explored why systems thinking matters and how optimising parts destroys the whole. Now we turn to perhaps the most practically important element of Deming’s System of Profound Knowledge: understanding variation.
This is where the rubber meets the road. Understanding variation explains why performance reviews are destructive, why targets cause gaming, why inspection doesn’t improve quality, and why most management interventions make things worse rather than better.
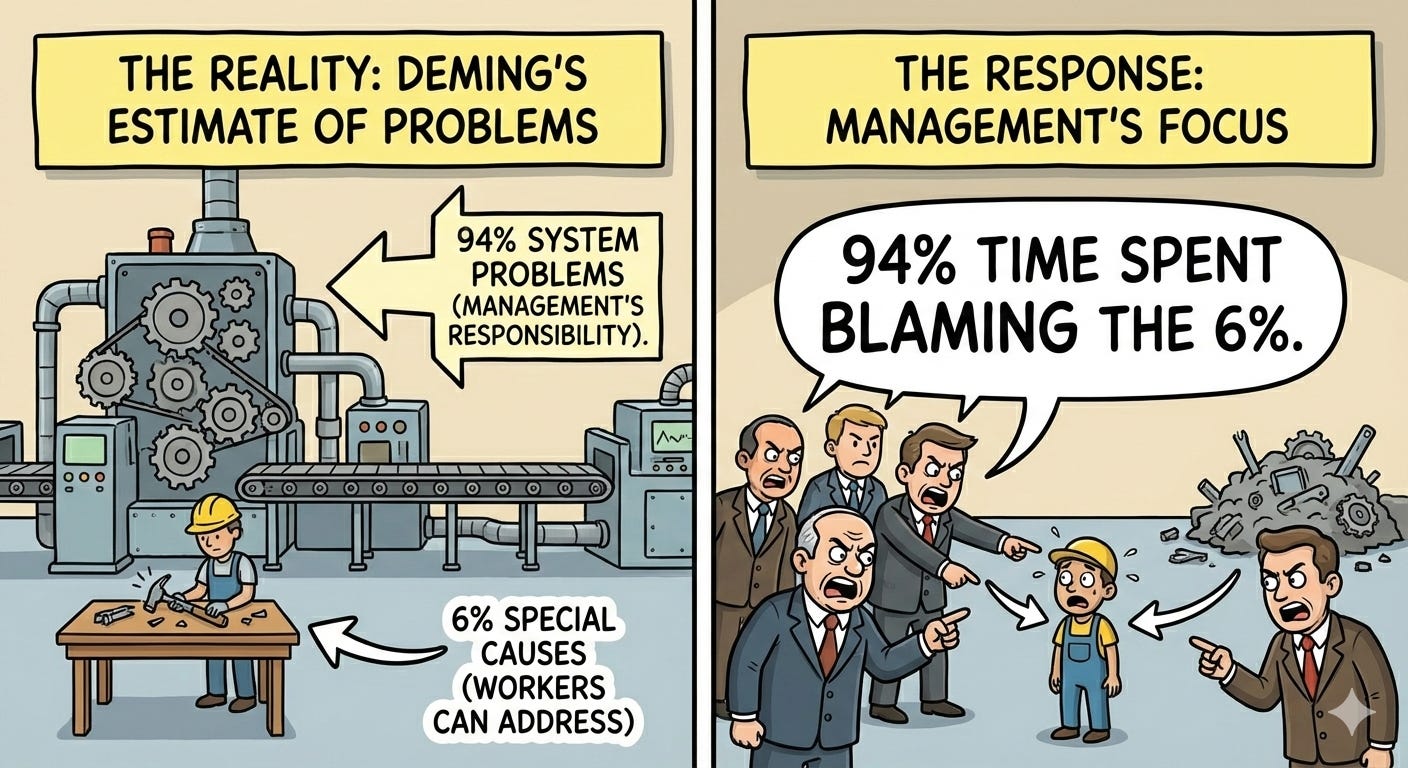
Deming estimated that 94% of problems in organisations are system problems - management’s responsibility to fix. Only 6% are special causes that workers can identify and address.
Yet managers spend 94% of their time blaming the 6%.
Variation Is Everywhere
Everything varies. Your commute to work doesn’t take exactly the same time each day. Production output varies from hour to hour. Customer orders vary from week to week. No two products are identical at the molecular level. No two employees perform identically day after day.
Variation is not the problem. Variation is reality. The problem is misunderstanding variation and reacting inappropriately to it.
Most organisations look at variation only in terms of specifications: within spec is good, out of spec is bad. This is dangerously incomplete. We need to change our paradigm. The critical question is not “Are we within specifications?” but rather “What type of variation are we seeing?”
There are two fundamentally different types of variation, and they require completely different responses. Treating one type as the other - which managers do constantly - increases variation, wastes resources, and destroys morale.
Common Cause vs. Special Cause
Common cause variation is inherent in the system. It’s the variation that exists because of how management designed and manages the process. It represents the normal, expected variation present all the time.
Think about your commute to work. Suppose it takes 20 minutes on average but varies between 15 and 25 minutes day to day due to traffic patterns, your driving speed, traffic lights, weather, and countless other factors. That 10-minute range is common cause variation - it’s built into your commuting system. Each factor has a tiny effect that can’t be individually measured. As long as you keep the same route and driving pattern, this variation remains consistent and predictable.
Special cause variation is not part of the way the process normally operates. It’s an abnormality - something that doesn’t usually happen. If you get a flat tyre and it takes 60 minutes to reach work, that’s special cause. It’s outside the normal range, it’s measurable, and it has an identifiable cause.
The critical differences:
Common cause:
Many sources (dozens or hundreds)
Each source has unmeasurable individual effect
Inherent in the system
Affects everyone
Stable and predictable over time
Requires changing the system to reduce
Management’s responsibility
Special cause:
Few sources
Measurable effect
External to the system
Affects individuals or specific instances
Sporadic and unpredictable
Can be identified and eliminated
Worker’s responsibility to flag
Here’s why this matters: The action required to reduce special cause variation is totally different from the action required to reduce common cause variation.
Special causes can be discovered and eliminated without changing the system. A flat tyre gets repaired. A defective batch of raw materials gets rejected. A broken tool gets fixed.
Common causes require changing the system itself. Only management has the authority to do this. Workers cannot change the system - they work within it.
The 94/6 Rule
Deming’s estimate: 94% of problems are common cause (system problems), 6% are special cause.
Yet most managers assume the opposite. When output is low, they blame workers for not trying hard enough. When defects occur, they exhort workers to be more careful. When deadlines are missed, they pressure people to work harder.
This is treating common cause as special cause - assuming the problem is with individuals when it’s actually the system. It’s Mistake #1.
The consequences:
Workers get blamed for problems they can’t fix
Morale declines (they’re trying hard already)
Fear increases (getting blamed for system failures)
Gaming increases (make the numbers look good, however possible)
Actual improvement doesn’t happen (system isn’t changing)
The Red Bead Experiment: A Stupid Experiment You’ll Never Forget
Deming called this “a stupid experiment that you’ll never forget.” It’s a vivid demonstration of the futility of most management systems.
The setup:
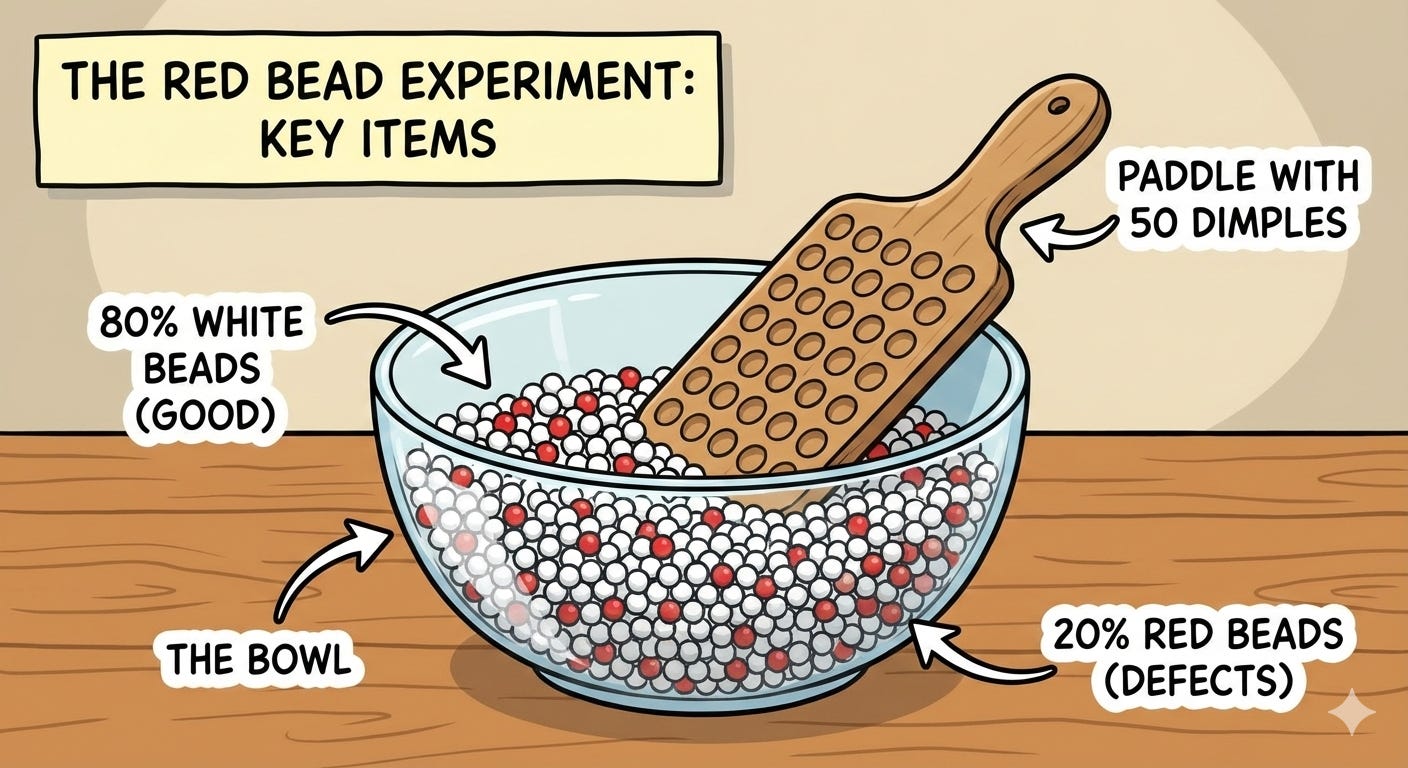
A bowl containing 80% white beads (good) and 20% red beads (defects)
A paddle with 50 dimples to scoop beads
The goal: Produce only white beads (zero defects)
Workers dip the paddle once (representing a day’s production)
Management has designed and purchased this “white bead process” for the workforce. There’s a major customer who needs white beads and will not accept anything less. Red beads represent everything that can go wrong: mechanical breakdown, defective parts, bad design, poor procedures and untrained workers.
What happens:
Each worker scoops a paddle of beads
Red beads appear (of course - 20% of the bowl)
Some workers get 8 red beads, others 12, others 15
Management ranks the workers: “Good job, Sarah - only 8 defects!” / “John, 15 defects are unacceptable. You need to improve.”
Bonuses for the best performers, threats for the worst
Next day: Sarah gets 14 red beads, John gets 9
Rankings reverse
Management is confused: “What happened? Why did Sarah’s performance decline?”
The reality:
Workers have ZERO control over the number of red beads. The red beads are in the system. Performance variation is purely random - determined by the system, not skill or effort.
Plot the results on a control chart and you’ll see: all points within control limits, no pattern, just common cause variation. The ranking of workers is arbitrary - measuring random variation in the system and attributing it to individuals.
Yet this is exactly what most organisations do:
Sales league tables (ignore variation in territory, market conditions)
Teacher rankings (ignore variation in student populations)
Hospital league tables (ignore variation in patient complexity)
Employee performance ratings (ignore variation in system conditions)
Most rankings are Red Bead Experiments. We’re measuring system variation and pretending its individual skill.
The lesson:
To decrease red beads, change the system. Get a bowl with fewer red beads. Change the process. No amount of encouragement, threats, bonuses, or rankings will help workers improve. They’re already doing their best within a system they didn’t design and can’t change.
The warehouse manager’s mistake:
Dr. Bill McNeese describes a distributor who kept a control chart on incorrect line items picked each day. The chart showed the process was in statistical control - only common cause variation present. Yet the warehouse manager believed pointing out mistakes to pickers would decrease errors.
He didn’t understand variation. He remembered the Red Bead Experiment from training (”yes, I remember red beads”) but couldn’t see that his warehouse was in the same situation. “This is real life, not red beads. Any worker can make fewer mistakes if they’re just more careful.”
Wrong. The mistakes are caused by the system: unclear labels, poor lighting, confusing product codes, time pressure, inadequate training and poor warehouse layout. The pickers are already being as careful as the system allows. Pointing out mistakes just increases fear and gaming (hide mistakes rather than report them).
To reduce errors, change the system. Management’s job.
The Funnel Experiment: Why Tampering Makes Things Worse
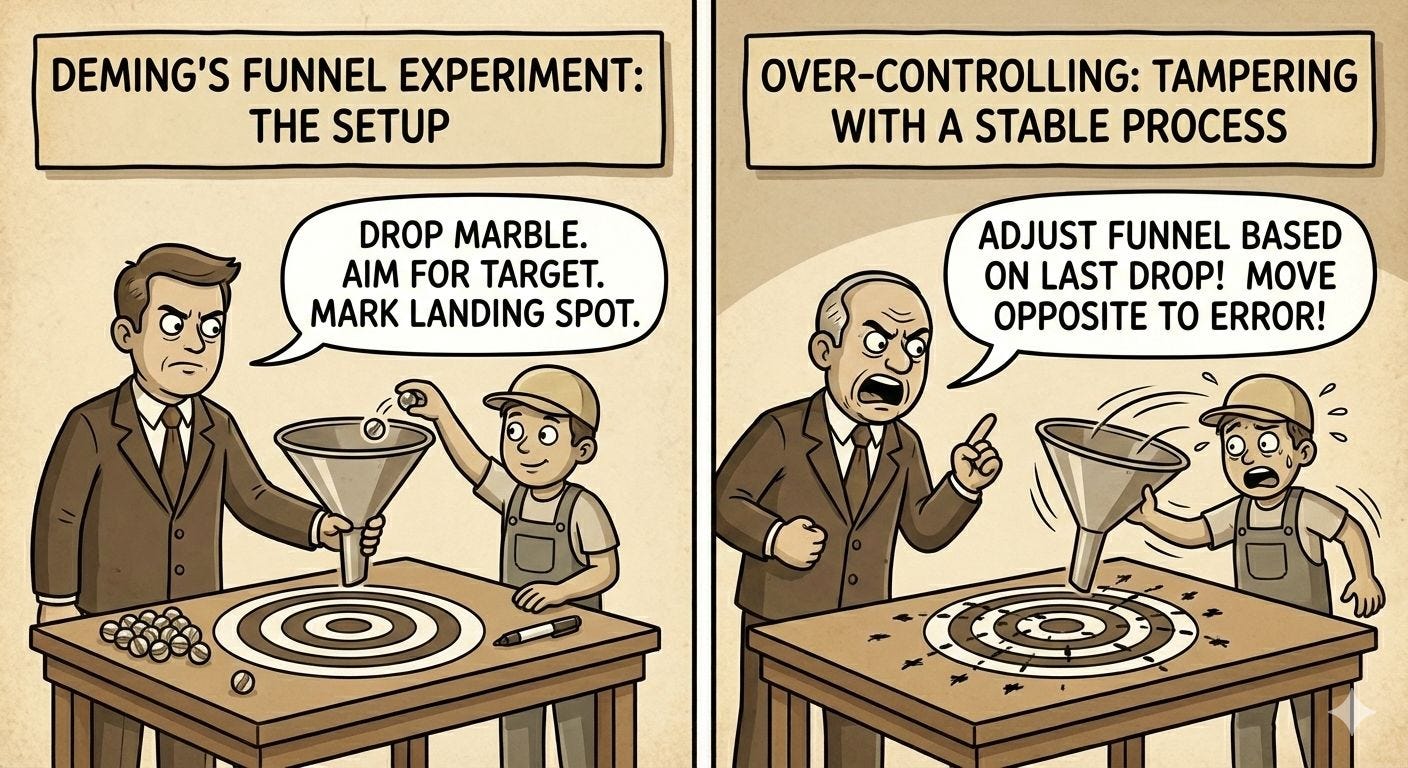
The funnel experiment demonstrates over-controlling - tampering with a stable process.
The setup:
Drop a marble through a funnel onto a surface
Try to hit a target
Mark where each marble lands
Apply different “adjustment rules” to improve aim
Rule 1: Leave the funnel fixed over the target
Marble drops and lands at various distances from the target
No adjustments made
Result: Stable variation, predictable pattern
This is the baseline - the system’s natural variation
Rule 2: After each drop, move the funnel to compensate
Marble lands distance “z” from the target
Move funnel distance “-z” from its last position (compensate for error)
Seems logical: correct for the last mistake
Result: Variation increases by over 40%
This is tampering
Why does it make things worse? Because you’re adjusting a stable process for common cause variation. The system already produces predictable variation. By adjusting for each random result, you add adjustment variation on top of system variation.
Management does this constantly:
Sales were low last month → change the sales strategy
This operator produced fewer units → give them special coaching
Costs were high this quarter → implement cost reduction programme
Customer satisfaction dipped → restructure customer service
If the system is stable (only common cause present), these adjustments increase variation rather than reduce it. You’re reacting to noise, not signal.
Rule 3: Move the funnel a distance from the target
Result: Even more unstable. The process drifts.
Rule 4: Set the funnel where the last marble landed
Result: Complete chaos. The system explodes.
Examples of tampering (Rule 2):
Adjusting the process based on a single data point
Changing strategy based on last quarter’s results
Recalibrating instruments to standard repeatedly
Adjusting quotas to reflect current output
Reacting to every dip in customer satisfaction
Stock market reaction to last month’s economic data
Examples of Rules 3 and 4:
Escalating enforcement (drug war - enforcement increases, prices increase, more drugs imported)
Gambler increases bets to cover losses
Telephone game (whisper a secret around a circle, message degrades)
Training replacements in succession (errors compound)
To avoid tampering: understand variation. Use control charts to distinguish common from special cause. If the process is stable (in control), leave it alone. Work on improving the system, not adjusting the process.
Control Charts: The Only Way to Distinguish
There is only one effective way to distinguish common cause from special cause: use control charts.
A control chart plots data over time with statistically calculated control limits (typically ±3 standard deviations from the mean). As long as:
No points fall outside control limits
No non-random patterns appear
...the process is “in statistical control” - only common cause variation is present. The process is stable, predictable, operating as the system was designed.
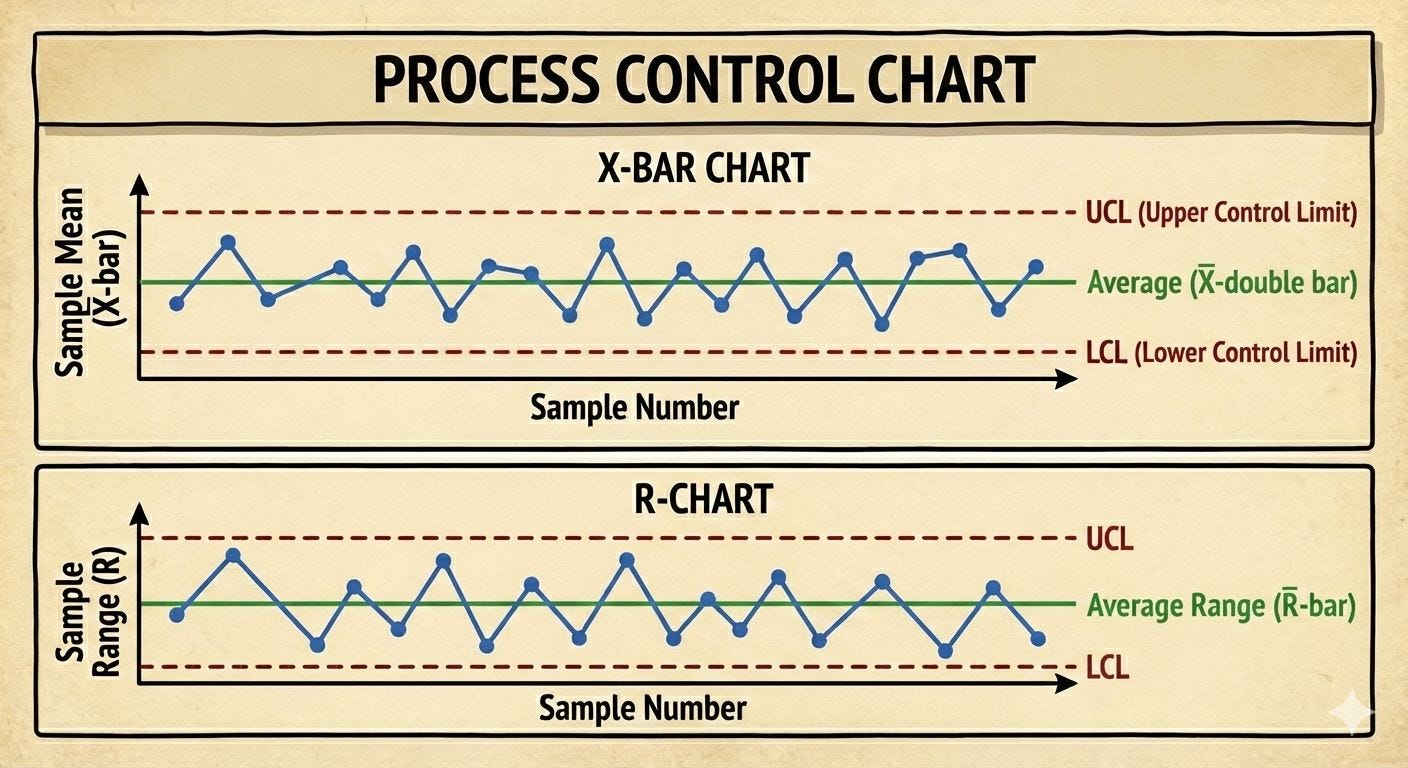
Points outside control limits or non-random patterns signal a special cause - something unusual happened, investigate and eliminate it.
Why this matters for improvement:
Step 1: Eliminate special causes (get process in control)
Step 2: Reduce common causes (improve the system)
You can’t effectively improve until special causes are eliminated. And once in control, tampering just makes things worse.
This is Point 3 of Deming’s 14 Points: Cease dependence on inspection to achieve quality. Eliminate the need for inspection on a mass basis by building quality into the product in the first place.
You can’t inspect quality in. You must build it in by understanding and reducing variation in the process.
The Two Fundamental Mistakes
Mistake 1: Treating common cause as special cause (tampering)
Adjusting a stable process for random variation
Blaming individuals for system problems
Reacting to every fluctuation
Increases variation
Most common management error
Mistake 2: Treating special cause as common cause (ignoring signals)
Assuming everything is “normal”
Missing real problems
Failing to investigate unusual results
Allows special causes to persist
You cannot avoid both mistakes completely. The goal is to minimise losses from mistakes, not eliminate mistakes entirely. Control charts provide the statistical framework for making the right decision most of the time.
Manufacturing Reality: The Injection Moulding Machine
An operator runs an injection moulding machine producing plastic components. Target weight: 50 grams. Components are weighed every 30 minutes.
The operator’s procedure (what seemed logical):
If the component weighs more than 50g, reduce the injection pressure
If the component weighs less than 50g, increase the injection pressure
“Keep it on target!”
What’s actually happening:
The process has a natural variation of ±0.5g around 50g. This is common cause variation - from temperature fluctuations, material consistency, ambient humidity, and normal wear. The process is stable.
The operator’s adjustments (Rule 2 of the Funnel Experiment):
Reading at 10:00: 50.3g (above target)
Action: Reduce pressure
Reading at 10:30: 49.8g (now below - partly from the adjustment, partly from natural variation)
Action: Increase pressure
Reading at 11:00: 50.4g (above again)
Action: Reduce pressure...
Result: By adjusting for every reading, the operator is adding “adjustment variation” on top of process variation. The actual spread has increased to ±0.9g. The operator is making things worse while trying to do his best.
This was management’s fault:
They hadn’t taught him about variation
They hadn’t provided control charts showing that the process was stable
They hadn’t explained common cause vs special cause
They gave him instructions that guaranteed he’d tamper
The questions management should have asked:
Is the weighing scale in statistical control? (Is it measuring consistently?)
How much variation does the measurement system itself contribute?
Is the moulding process in statistical control?
If stable, what’s the process capability? (Can it meet ±1g tolerance?)
If not capable, what system changes are needed? (Better temperature control? More consistent material? Upgraded tooling?)
These are management questions. The operator works IN the system. Management works ON the system.
The realistic case:
A control chart would have shown that the process was stable at ±0.5g. Well within tolerance. Leave it alone.
If management wanted to improve capability, they’d need to:
Invest in better temperature control (system change)
Work with the material supplier on consistency (system change)
Upgrade to more precise tooling (system change)
Improve maintenance schedules (system change)
Not: tell the operator to adjust for every result.
Why Performance Reviews Are Destructive
Now we can understand why Deming called performance appraisal one of the “Seven Deadly Diseases” of management.
Performance reviews assume all variation in performance is special cause - that outcomes reflect individual effort, skill, and dedication. But if 94% of the variation is common cause (system-determined), then performance reviews are mostly measuring system variation and attributing it to individuals.
The Red Bead Experiment again:
Sarah produces 8 defects (gets a high rating, bonus)
John produces 15 defects (gets a low rating, warning)
Next period: Sarah produces 14, John produces 9
Was Sarah lazy? Did John suddenly improve?
No - both were always producing what the system allowed
In real organisations:
Salesperson A sells £2M (promoted)
Salesperson B sells £1.5M (performance improvement plan)
But A has a wealthy territory, B has a poor territory
The £500k difference is mostly territory (system), not skill
Ranking them pretends the system doesn’t exist
The damage:
Creates competition instead of cooperation (everyone protecting themselves)
Destroys intrinsic motivation (focus shifts to rating, not work)
Encourages gaming (meet the numbers anyway possible)
Increases fear (getting blamed for system problems)
Based on the past, not the future (no focus on improvement)
Assumes outcomes are controllable (ignores system constraints)
If you must evaluate people (hiring, promotion decisions), do it based on understanding variation. Is this person’s performance outside the system’s normal variation? Or are they simply at one end of the system’s range this period?
Most “performance differences” are system variations. Treating them as individual differences is Mistake #1: treating common cause as special cause.
Connection to Kahneman and Cognitive Biases
Daniel Kahneman’s work on cognitive biases explains WHY managers make these mistakes so consistently.
Fundamental attribution error: We attribute outcomes to individuals when they’re actually system-caused. Someone succeeds → “they’re talented.” Someone fails → “they didn’t try hard enough.” We under-weight situational factors (the system) and over-weight individual factors.
Pattern seeking: System 1 (fast, intuitive thinking) sees patterns in random data. The Red Bead Experiment generates random variation, but managers see “Sarah improved” and “John declined” when it’s just noise.
Regression to the mean: Extreme results are usually followed by more average results (regression toward the mean). Managers see this as “they got complacent” or “they responded to my criticism” when it’s just mathematics.
Outcome bias: We judge decisions by outcomes, not processes. Sales were high → “good strategy.” Sales were low → “bad strategy.” But outcomes have variation - good strategies sometimes produce poor results, bad strategies sometimes produce good results.
Deming anticipated these cognitive errors and provided the statistical framework to correct for them. Control charts counteract our intuition’s tendency to see patterns in noise. Understanding variation prevents attributing system effects to individuals.
This is why statistics matter. Not for abstract mathematical purity, but because our intuition consistently misleads us about variation. We need rigorous methods to overcome our biases.
Getting Started with Understanding Variation
To begin applying this knowledge:
1. Educate everyone about variation
Not just management, not just the quality department - everyone. Operators need to understand why they shouldn’t tamper. Managers need to understand why they shouldn’t blame. Make the Red Bead Experiment and Funnel Experiment part of your culture.
2. Implement control charts where it matters
Not everywhere (measurement burden matters), but on critical processes. Manufacturing processes, defect rates, delivery times, customer satisfaction - anything important to the system’s aim.
3. Teach the two fundamental mistakes
Make it explicit: treating common as special (tampering) and treating special as common (ignoring). Give people the language to identify which mistake is being made.
4. Stop tampering
When someone suggests “let’s adjust the process” or “give that person feedback,” ask: Is the process in control? If yes, adjusting it will increase variation. Work on the system instead.
5. Review policies that assume all variation is individual
Performance reviews, merit pay, rankings, quotas, targets - these all assume variation is special cause (individually controlled). If 94% is a common cause, these policies are fundamentally wrong.
This requires management commitment. It requires statistical training. It requires patience. But without understanding variation, you cannot improve. You’ll just react to noise, blame people for system problems, and make things worse through well-intentioned tampering.
The Compound Effect
Understanding variation is essential to the compound deflation thesis I’ve developed.
Here’s why: Continuous improvement requires knowing what’s improvement and what’s noise. If you can’t distinguish signal from noise, you can’t learn. You’ll celebrate random good results and panic at random bad results, neither of which teaches anything.
With control charts and understanding variation:
Year 1: Process in control, baseline capability established (common cause variation = X)
Year 2: Improvement effort, common cause variation reduces to 0.9X (real improvement)
Year 3: Further improvement, common cause variation = 0.8X (compounds on year 2)
Year 10: Common cause variation = 0.5X (cumulative improvement is dramatic)
Without understanding variation:
“Last month was great! Let’s keep doing what we did!” (might have been random)
“This month was terrible! Change the process!” (might have been random, now you’re tampering)
Process becomes less stable over time (tampering adds variation)
No systematic improvement (reacting to noise, not improving the system)
Toyota’s 70 years of continuous improvement required understanding variation. They don’t react to every fluctuation. They use control charts. They improve the system systematically. That’s why their manufacturing capability compounds whilst others tamper and go nowhere.
This is invisible in quarterly results. But over 20 years? The organisation that understands variation and systematically reduces common cause builds an insurmountable advantage.
The Patient Statistical Thinking
Most organisations want dramatic breakthroughs. Deming offered patient, systematic thinking:
Understand what type of variation you’re seeing
Don’t tamper with stable processes
Eliminate special causes first
Then work on reducing common causes
Use data, not intuition
Think about processes, not outcomes
Hold management responsible for systems, not workers responsible for system problems
It’s not exciting. It’s not dramatic. It doesn’t produce quarterly wins. But it works.
And that’s why, 40 years after encountering these ideas, I’m still writing about them. Because they’re still true. Because most organisations still don’t do it. Because understanding variation is the foundation of everything else in quality improvement.
The 94% Problem isn’t that workers cause 94% of problems. It’s that 94% of problems are system problems, yet management spends 94% of its time blaming workers. Understanding variation fixes this fundamental mistake.
Once you see variation correctly, you can’t unsee it. You recognise tampering everywhere. You see the Red Bead Experiment in every league table and ranking. You understand why exhortations and targets don’t work. And you begin the patient work of improving systems rather than blaming people.
Next in this series: Management is Prediction - The PDSA Cycle and the Theory of Knowledge
The bibliography for the series is at the end of Part 1: